When you first try to learn markets, the jargon alone is a lot: stock indices, rates, FX, the fear index, and a hundred more. Trying to memorize them one at a time never ends. It gets much simpler once you group them into a few big buckets. This guide walks through what each bucket is and how they connect, and points you to a deeper guide for each. Think of it as a map, not the whole territory.
Markets in six buckets
What you can invest in mostly splits into six groups: stocks, rates (bonds), FX, commodities, crypto, and market sentiment (the macro backdrop). They look separate, but they push and pull on each other, and interest rates sit at the center of most of it. Here they are one at a time.
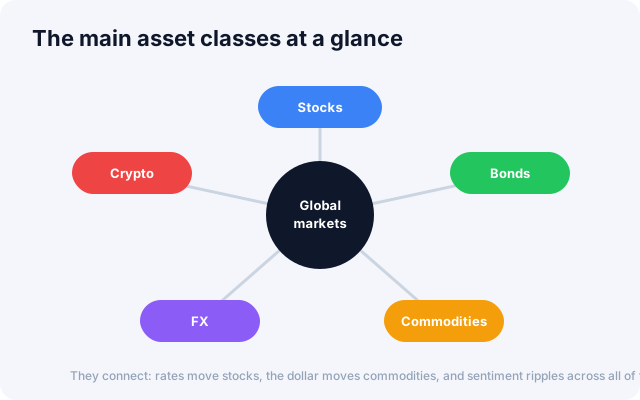
They connect: rates move stocks, the dollar moves commodities, and sentiment ripples across all of them.
1. Stocks: owning a piece of a company
A stock is a slice of a company. Over time its price tracks what people expect the company to earn, now and in the future.
- The basic yardsticks for cheap versus expensive are in stock valuation (P/E, P/B).
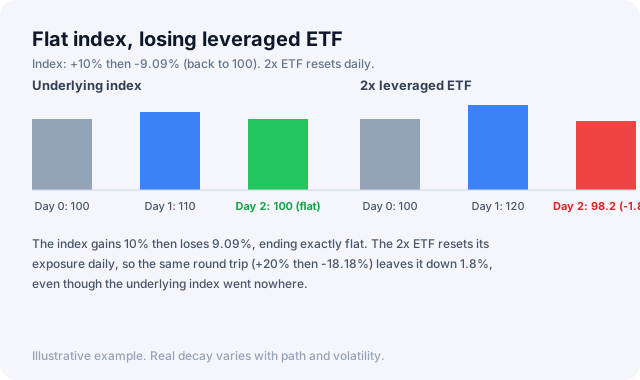
- If a single name feels risky, ETFs let you spread across a whole market or sector.
- Dividend investing pays you cash just for holding.
- To see which sectors money is rotating into, read sector rotation.
2. Rates and bonds: the benchmark for everything
Rates are the "price of money," so they anchor almost every other asset. When rates rise, risk assets like stocks usually face a headwind.
- Start with the world's benchmark, the US 10-year Treasury yield.
- The yield-curve spread is an early clue to recession.
- Bond prices move opposite to yields, and bond basics explains why.
- For who sets rates and when, see the Fed and the FOMC.
3. FX: the relative price of money
An exchange rate is just the ratio between two currencies. It connects exporter earnings, import prices, and the flow of foreign capital.
- For overall dollar strength, watch the dollar index (DXY).
- The bigger forces behind currencies are in what moves FX.
- For a Korea angle, see USD/KRW and Korean equities.
4. Commodities: signals from the real economy
Commodity prices tend to mirror inflation and the state of the economy. The two headline names are gold, the classic crisis hedge, and crude oil, which reacts to both inflation and growth.
5. Crypto: a newer risk asset
Crypto is volatile, but it is useful for reading risk appetite. For the whole market's direction, watch market cap and BTC dominance. For Bitcoin's own value cycle, on-chain indicators go a level deeper.
6. Sentiment and macro: the mood and the big picture
This is the layer above individual prices: the temperature of the whole market. Volatility shows up in the VIX and mood in the Fear & Greed Index. For the economy underneath, watch CPI for inflation, employment data for jobs, and PMI/ISM for what is coming next.
How to actually start
Rather than memorizing every indicator, get the mindset and habits right first.
- Diversify. Not putting everything in one place is the most basic defense you have. See diversification and asset allocation.
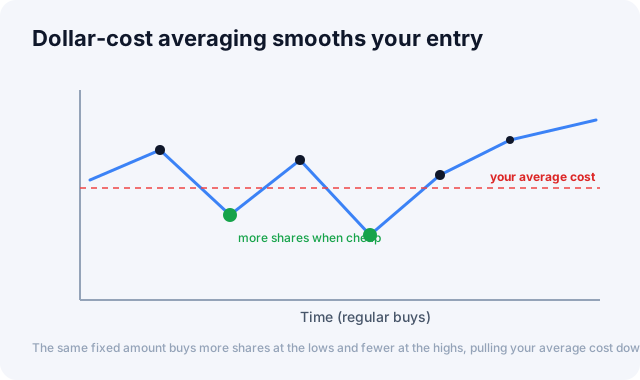
- Make time your ally. Over a long horizon, compounding does more of the work than any single trade.
- Learn not to lose first. Staying in the game matters more than chasing returns, which is what risk management is about.
Indicators worth watching alongside
All six buckets end up moving together. The Global Market Dashboard puts stocks, rates, FX, commodities, crypto and sentiment on one screen, so you can see roughly where the market stands at a glance. Keep it open next to the guides above as you learn.
Primary source: How stock markets work, SEC
This article is for informational purposes only and is not investment advice.