Whenever markets lurch, you hear that "the VIX fear index has spiked." Unlike a stock chart, the VIX is not a price gauge. It shows how much the market expects prices to move going forward. This article walks through exactly what the VIX measures, what reading counts as a danger sign, and how to react when the VIX spikes the way it has recently.
What the VIX is
The VIX, calculated by the Chicago Board Options Exchange, expresses the expected volatility of the S&P 500 over the next 30 days, as implied by options prices, on an annualized percentage basis. The key word is "expects." The VIX does not look at how much prices moved in the past. It looks at how much the market thinks they will move ahead, a concept called implied volatility.
Options work a bit like insurance. The more investors worry about a decline, the more they pay for that insurance, especially puts, and the pricier the premium gets, the higher the VIX climbs. A soaring VIX means the market is bracing for large moves, particularly a sharp drop. That is where the nickname "fear index" comes from.
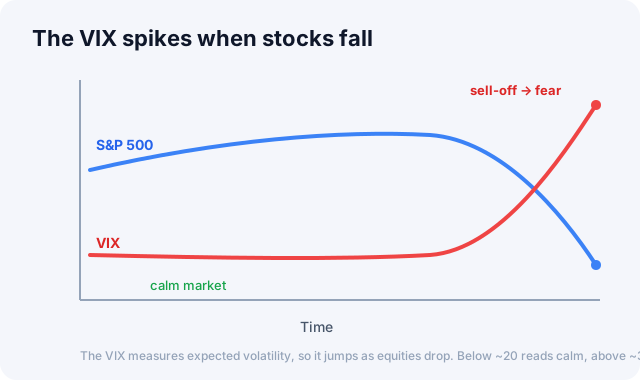
The VIX measures expected volatility, so it spikes as stocks sell off; below ~20 reads calm, above ~30 fearful.
How to read the numbers
The VIX has no fixed "correct" band, but traders read it roughly like this:
- 12-16 (low): a calm, optimistic market with little volatility and gentle trends.
- 17-25 (normal): everyday levels of uncertainty.
- 25-35 (high): real tension, with growing pressure toward a correction.
- 35 and up (extreme): panic. During the 2008 financial crisis and the 2020 pandemic shock it topped 80.
A VIX of 16 works out to roughly "the market expects the S&P 500 to move within about plus or minus 4.6% over the next month" (16 divided by the square root of 12). In other words, the VIX is close to an annualized standard deviation of volatility.
The VIX and stocks move opposite each other
The VIX's most important trait is that it tends to move against stock prices. When stocks fall sharply, investors rush to buy insurance and the VIX spikes. When stocks drift up gently, the VIX settles down. Because of this, a VIX spike often gets read as a "peak fear" signal that shows up near market bottoms.
There is a twist worth knowing: an unusually low VIX can be a warning sign of its own. When volatility stays quiet for a long stretch, investors get complacent and leverage builds up in the system, so even a small shock can make volatility erupt. That is the logic behind the old trading saying, watch out for volatility when it's low.
The limits of the VIX
Seeing the VIX spike like this, it's tempting to ask "should I just buy a VIX-linked product right now?" The VIX has a few real limits worth knowing before you do.
- It measures size, not direction. The VIX tells you how much the market may move, not which way, though in practice spikes tend to accompany declines.
- It is a short-term gauge. It only looks 30 days ahead, so it is a poor tool for judging long-term trends.
- You cannot trade it directly. You can only track the VIX indirectly through futures, options, and exchange-traded products, and roll costs mean these products do not follow the index exactly.
Indicators worth watching alongside
The VIX paints a clearer picture of market stress when you read it next to the Fear & Greed Index, the put/call ratio, and credit spreads (the junk-bond yield gap) rather than viewing it alone. When several indicators point to fear at the same time, the signal becomes more reliable.
The Global Market Dashboard shows the VIX as a live ticker and chart, with a short explanation under the info icon next to it. Use it as a quick way to check the market's felt temperature. If you want the wider context first, see Getting Started with Global Markets.
Primary source: VIX, Cboe
This article is for informational purposes only and is not investment advice.