FearGrid is a dashboard that gathers global markets onto one screen through the lens of 'fear and greed.' Stocks, rates, FX, commodities, crypto and market sentiment are usually scattered across many places, but they sit here together, each explained in guides we write ourselves.
The 'Market Conditions' panel at the top is our own indicator, computed directly from the US Federal Reserve's public data (FRED). It combines the yield-curve spread, credit spreads, volatility and market sentiment into one summary of the market's temperature right now. It isn't a copy of any single institution's index. It's public data synthesized our own way.
You don't need to memorize numbers. Skim the market with the dashboard below, and whenever an indicator is unfamiliar, learn the concept in 'How to read the key indicators' just below, or in the linked guide. If you're new, we suggest starting with 'Getting Started with Global Markets.'
Guides
40 original, in-house guides that break down the concepts you need to read the market, with tables, diagrams, and worked examples.
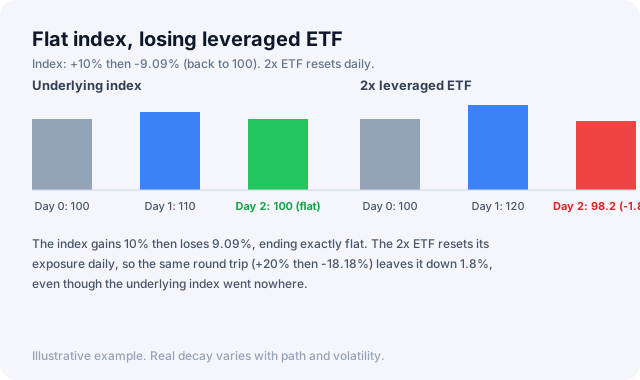
How leveraged and inverse ETFs reset daily, why volatility decay happens (with real numbers), Korea's leveraged-ETF boom, and its new 2026 safeguards.
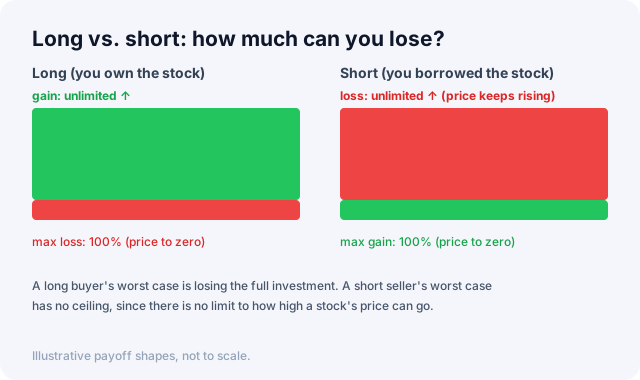
How short selling actually works, why its loss potential is unlimited, what a short squeeze is, naked shorting, and Korea's 2025-2026 short-sale rules.
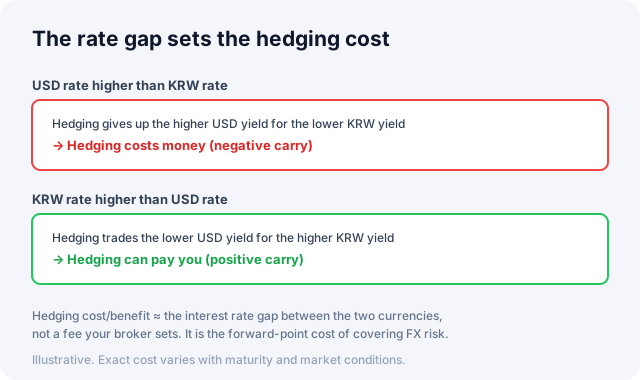
How hedged ETFs remove exchange-rate swings, why hedging cost is not a fee, its link to interest rate gaps, and when to choose hedged over unhedged.
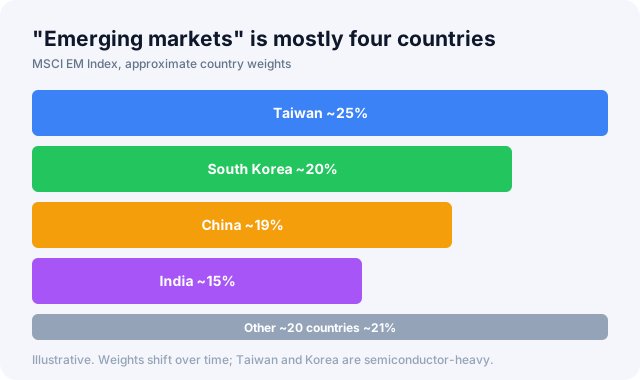
Why emerging markets attract investors, what the MSCI EM Index actually holds, its tight link to the dollar, and the risks worth knowing first.
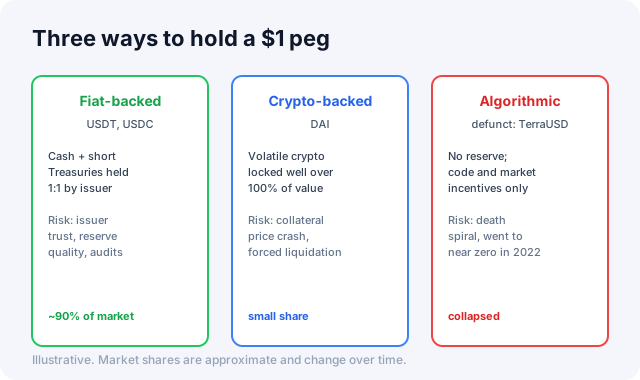
How USDT and USDC hold their peg, what each stablecoin design risks, the Terra collapse, and the new U.S. GENIUS Act framework.
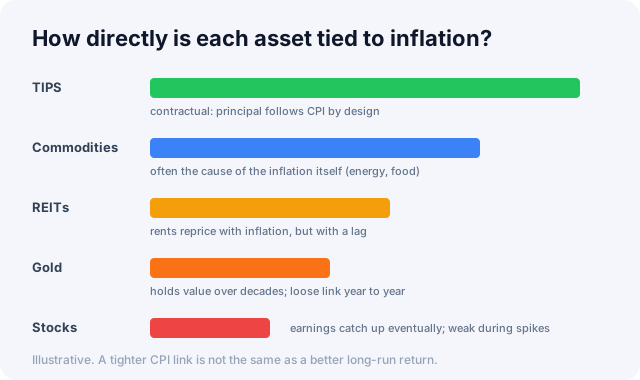
How gold, TIPS, commodities, REITs, and stocks each respond to inflation, what every hedge costs you, and how to combine them in one portfolio.
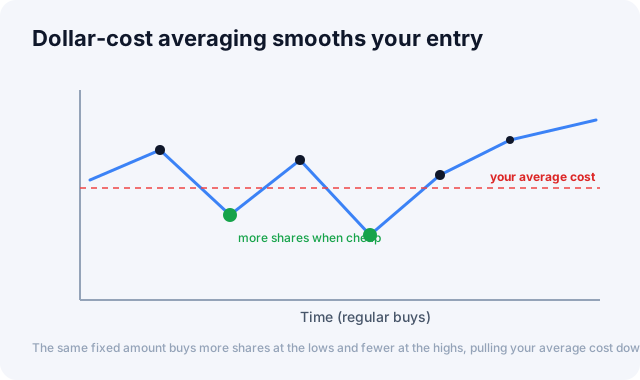
How dollar-cost averaging works, why it lowers your average cost, what the research says about lump-sum investing, and when each fits.
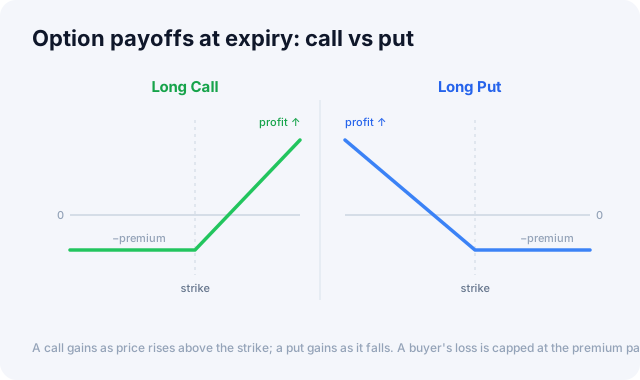
What a call and a put are, how options make or lose money, why time and volatility drive their price, and how implied volatility connects to the VIX.
Market Conditions
A snapshot of today's macro & financial conditions (not a forecast)Today's Markets
Indices · FX · Rates · Risk at a glanceTop coins
Major cryptocurrency pricesPowered by CoinPaprika
Market Sentiment
Explore more
How to read the key indicators
A one-line summary of what the main indicators on the dashboard mean. Each links to a fuller guide.
VIX (the fear index)
The 30-day expected volatility priced into S&P 500 options. Below 20 usually reads as calm, above 30 as fear. When the VIX rises, the market is nervous.
Read the guide →Fear & Greed Index
Puts investor sentiment on a 0 (extreme fear) to 100 (extreme greed) scale. Excessive greed can mean overheating; excessive fear can be a clue to a rebound.
Read the guide →US 10-year Treasury yield
The benchmark rate for asset prices worldwide. When it spikes, it weighs on stocks and growth names. Watch whether it's rising on growth hopes or inflation fears.
Read the guide →Yield-curve spread
The 10-year minus the 2-year yield. A negative value (inversion) is a classic recession lead that has flagged several downturns historically.
Read the guide →Dollar Index (DXY)
The dollar's combined strength against six major currencies. A stronger dollar tends to be a headwind for commodities, emerging markets and exporters.
Read the guide →Bitcoin dominance
Bitcoin's share of total crypto market cap. A rise signals money concentrating into Bitcoin; a fall signals it spreading into altcoins.
Read the guide →Frequently asked questions
What is FearGrid?
A free market dashboard that gathers global stock, rate, FX, commodity, crypto and sentiment indicators onto one screen, and explains how to read each in 24+ guides.
How often is the data updated?
It depends on the indicator. Quotes are near real-time, while Fed and macro data update on their release cadence (daily, weekly, monthly). The 'Market Conditions' and sentiment indices update every business day.
How is the 'Market Conditions' index built?
FearGrid computes it directly from the US Federal Reserve's public data (FRED), synthesizing the yield-curve spread, credit spreads, volatility and market sentiment. It isn't a copy of any single institution's index.
How should I use these indicators?
Rather than judging by one alone, it's best to read rates, sentiment and volatility together to gauge the big picture of whether the market is risk-on or risk-off. The guide next to each indicator helps with interpretation.
Is this investment advice?
No. FearGrid is for information and education only, and does not recommend any specific security or trade. Investment decisions and their consequences are the user's own.
Is there a fee?
It's free. We credit our data sources (FRED, CoinPaprika, Alternative.me, ECB and others), and display licensed indicators via the provider's official widget.