A single Consumer Price Index release each month can rock stocks and bonds at the same time. Inflation means more than the everyday sense that things are getting more expensive. Prices steer the central bank's rate decisions, and those rates in turn become the benchmark for every asset price.
What inflation and the CPI are
Inflation is a sustained rise in the general price level. The flagship gauge that captures it as a number is the CPI, which tracks the prices of a basket of goods and services households buy and shows how much they've risen versus a year earlier.
The CPI comes in two versions. Headline CPI covers the full price level, including energy and food. Core CPI strips out those volatile energy and food categories, and is considered a better read on the underlying trend, which is why it gets special attention from central banks and markets.
When we say prices are rising or falling, we usually mean whether the rate of increase is speeding up or slowing down. Even when that rate slows, a state called disinflation, prices are still rising. That's different from deflation, where the price level actually falls.
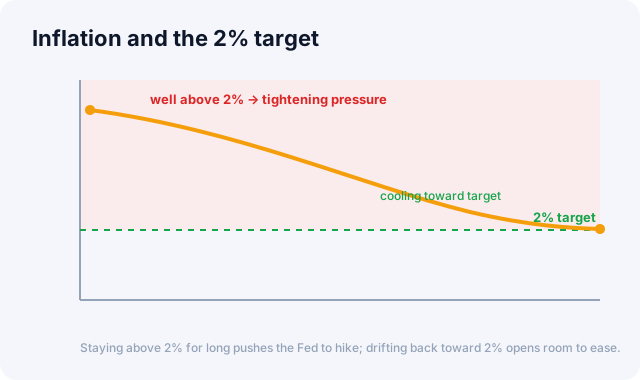
Staying above 2% for long pushes the Fed to hike; drifting back toward 2% opens room to ease.
Why markets react so sharply
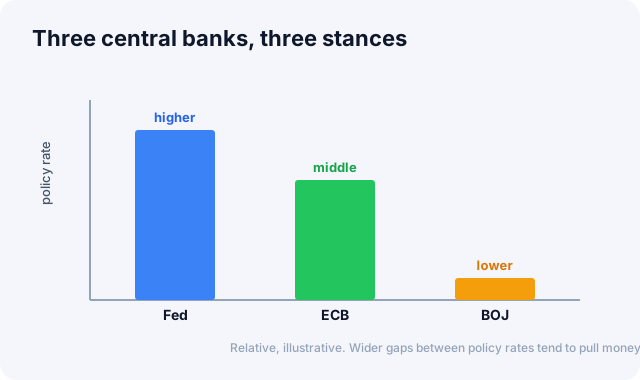
The key link is the central bank. When inflation runs above target, often around 2%, and proves sticky, the Fed raises rates to cool demand. When rates rise, a higher discount rate weighs on stock valuations and pushes existing bond prices down. When prices stabilize instead, room opens up for rate cuts, which favors risk assets.
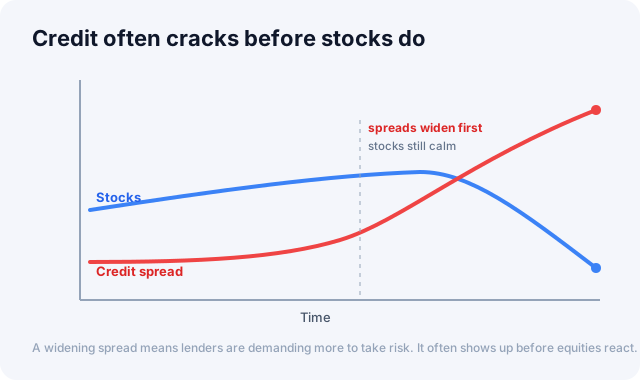
So when CPI comes in hotter than expected, stocks and bonds often weaken together on fears that rates will stay high for longer; when it comes in cooler, a relief rally tends to follow. Here too, the crux is the surprise relative to expectations, not the absolute number.
Different effects by asset
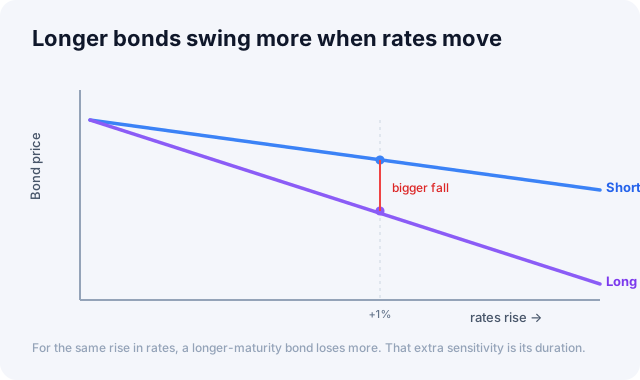
Cash is the direct victim of inflation. As prices rise, cash loses purchasing power outright. Bonds pay a fixed coupon, so they're vulnerable too, and the longer the maturity, the bigger the hit. Stocks present a mixed picture: moderate inflation isn't necessarily bad, since firms can raise prices and grow revenue, but sharp, high inflation becomes a burden through rising costs and rate hikes, and companies with strong pricing power tend to fare relatively better. Real assets like gold, commodities, and real estate are traditionally cited as inflation hedges, though they're not foolproof and their effectiveness varies with the rate environment.
Watch real rates too
From an investing standpoint, what matters more is the real rate, meaning the nominal rate minus inflation. When real rates run negative, with inflation above the nominal rate, holding cash and bonds erodes purchasing power, so money tends to flow into risk assets or gold. When real rates rise instead, safe assets become more attractive again.
How to read it
- Watch the trend. The direction over several months, accelerating or decelerating, matters more than a single month's number.
- Check core inflation and the details. The stickiness of shelter and services prices drives the underlying trend.
- Consider the Fed's reaction function. The same number can be read differently depending on what the Fed weighs most at the time.
Indicators worth watching alongside
Inflation comes into focus when grouped with the Fed funds rate, Treasury yields, and the gold price.
In the macro tab of the Global Market Dashboard, the U.S. CPI rate is shown alongside the policy rate, Treasury yields, and jobs data. Check which way prices are heading now. For the wider picture, see Getting Started with Global Markets.
How FearGrid's Market Signal reads this
Inflation is one of the three pillars of the Market Signal index that FearGrid computes itself from public data. The inflation pillar measures how far core CPI (excluding food and energy), year over year, sits from the Fed's 2% target. The closer to target, the more supportive for risk assets; the further away in either direction, the more of a headwind. This pillar carries a 20% weight in the composite, smaller than rates (35%) and sentiment (45%), but it anchors the direction.
This reading too is converted into its position relative to the past three years (the three-year average sits in the middle), so you can see at a glance whether inflation is running hotter or cooler than normal. Check the Market Signal at the top of the home page to see where the inflation pillar sits now.
Primary source: Consumer Price Index, U.S. BLS
This article is for informational purposes only and is not investment advice.