Money in the market doesn't sit still. As the economic phase changes, capital moves from one sector to another. That flow is called sector rotation, and behind it sits the business cycle. Even within the stock market, reading where money is gathering and where it's leaving gives you a more three-dimensional sense of how the market views the economy.
What the business cycle is
The economy broadly repeats four phases: recovery, expansion, slowdown, and recession. Growth, employment, inflation, and rates move together, and investors reposition across sectors to front-run the next phase. The key point is that the market moves on what it sees 6 to 12 months ahead, not on the present.
Cyclicals vs. defensives
Rotation is easy to grasp once you split sectors in two.
Cyclicals are industries that earn more when the economy is strong and much less when it's weak, including consumer discretionary names like autos and travel, tech, industrials, materials, and financials. They shine when people open their wallets and companies invest. Defensives are the things people use no matter what: consumer staples like food and household goods, utilities, and health care. Demand barely falls in a downturn, so they hold up relatively well in a recession.
Rotation is ultimately capital moving between these two groups, and among the sub-sectors within them.
Which sectors lead in each phase
Historically, the sectors that led each phase look like this, though it's not an iron law.
| Phase | Environment | Sectors that tended to lead |
|---|---|---|
| Recovery | End of recession, low rates, off the bottom | Consumer discretionary, tech, financials |
| Expansion | Accelerating growth, improving earnings | Tech, industrials, materials |
| Slowdown | Overheating, rising inflation, rate hikes | Energy, commodities (inflation beneficiaries) |
| Recession | Falling demand, rate cuts begin | Staples, utilities, health care (defensive) |
The intuition runs like this: when rates sit at the bottom, companies that grow on borrowed money, like tech and discretionary names, benefit. When the economy overheats and inflation and rates rise, real assets like commodities hold up better. Then as the economy rolls over, people flee to defensive sectors selling what you have to buy anyway.
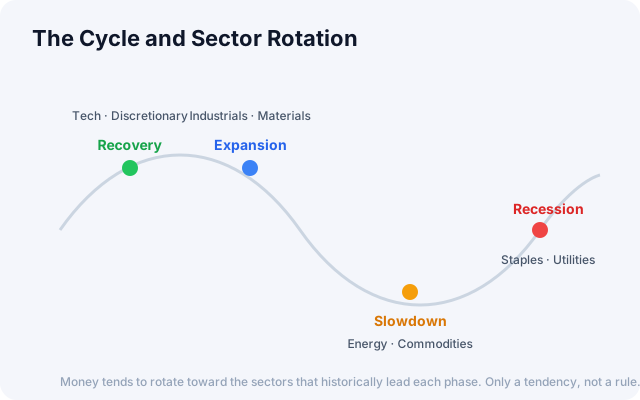
As the economy moves through recovery, expansion, slowdown and recession, the leading sectors rotate. It's a tendency, not a rule.
How to gauge the phase
The exact phase is only clear in hindsight, but a few indicators help. The yield-curve spread, with inversion followed by re-steepening, is a classic recession-then-recovery signal. Inflation (CPI) and the Fed's rate direction separate slowdown from expansion, and the tail end of a hiking cycle often overlaps the slowdown phase. PMI/ISM and employment data act as the cycle's thermometer, alongside manufacturing activity.
The limits of sector rotation
A caveat is worth keeping in mind: because the market prices the phase in advance, by the time an indicator shows up in the news, the relevant sector has often already run. Phase boundaries are fuzzy too, and the leading sector differs each time even within the same phase, since one recovery might get led by tech and another by energy. Cycle lengths vary as well, so things rarely play out in the textbook order.
So rotation is safer used as a framework for reading and interpreting capital flows, not a tool for nailing the perfect timing. Hopping between sectors trying to call the phase, and racking up trading costs and taxes in the process, can actually hurt from the standpoint of compounding and risk management.
FAQ
Q. Can an individual beat the market with sector rotation? It's hard. The market prices things in fast, and calling phase turns in real time is very difficult. For many investors, diversifying with a broad-market ETF and then fine-tuning weights is more realistic.
Q. How do I invest in a sector? Sector ETFs are more convenient than single names for diversification. The US has well-developed ETFs for the 11 GICS sectors, making it easy to adjust exposure at the sector level.
Q. How can I be sure which phase we're in? You can't be sure, and that's closest to the truth. Rather than relying on one indicator, form a hypothesis from the yield curve, inflation, PMI, employment, and sector performance together, then revise it as the data changes.
How to use it
- Start with which sectors are strong now. Check where money is flowing today, based on sector performance, first.
- Tie it to the macro backdrop. Reading it alongside rates, inflation, and the yield curve makes your phase call sturdier.
- Keep diversifying. Rather than going all-in on one phase, adjusting weights while keeping core diversification is the realistic approach.
Indicators worth watching alongside
The stocks tab of the Global Market Dashboard has US sector performance, so you can see at a glance where money is flowing today, and tie it to rates, the yield curve, and inflation on the macro tab to gauge the phase. Frame the whole picture in Getting Started with Global Markets.
Primary source: Business cycle dating, NBER
This article is for informational purposes only and is not investment advice.