A single line in the news, "the U.S. 10-year Treasury yield rose," can shake stocks, real estate, and currencies all at once. People call the 10-year yield the benchmark rate for asset prices worldwide. Why does one number carry that much weight?
What the 10-year Treasury yield is
It is the yield on a 10-year bond issued by the U.S. Treasury. Because Treasuries are considered close to free of default risk, this yield acts as the reference point for the risk-free long-term rate. You can think of every other risk asset as priced by adding some risk premium on top of it.
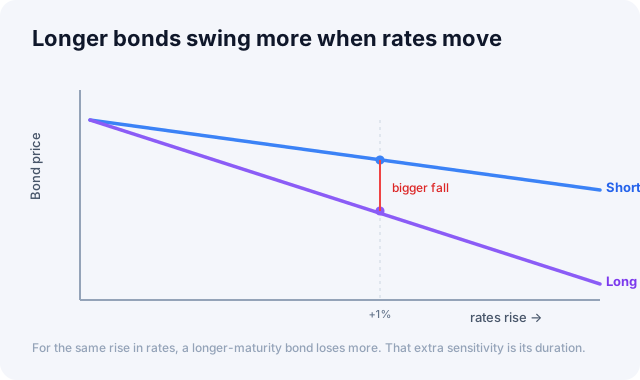
The crucial part is that bond prices and yields move in opposite directions. When demand to buy Treasuries lifts prices, yields fall. When selling pressure pushes prices down, yields rise.
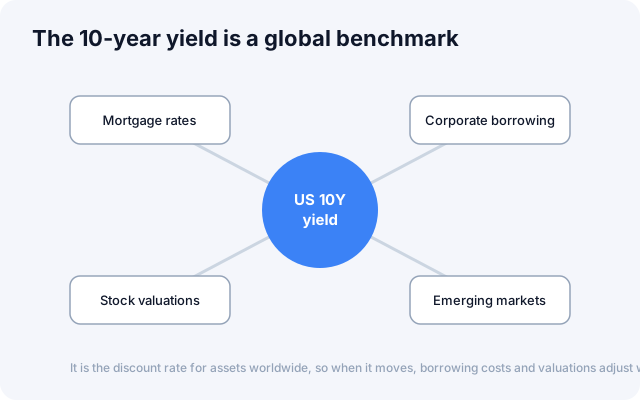
It is the discount rate for assets worldwide, so when it moves, borrowing costs and valuations adjust with it.
What moves the 10-year yield
It helps to split the 10-year yield into two pieces.
Expectations for future growth and inflation make up the first. When growth and prices are expected to rise, long-term yields climb with them. Inflation is a direct threat to bond investors in particular, so when inflation expectations rise, they demand a higher yield to compensate.
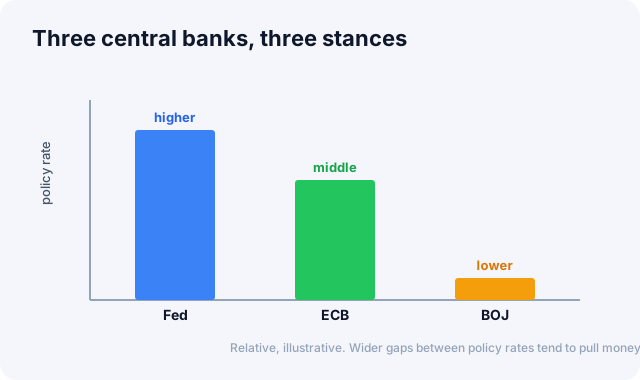
Expectations for the Fed's policy path make up the second. Long-term yields do not track this as closely as short-term rates do, but they still reflect the market's average guess at how the Fed will steer rates over time.
On top of both, safe-haven demand (yields fall as money piles into Treasuries during a crisis), the supply and demand for Treasuries themselves (issuance volume, buying by foreigners and central banks), and worries about fiscal deficits all play a role.
Why it shakes asset prices
The main channel through which the 10-year yield ripples across other assets is the discount rate.
Think of a stock's value as the present value of all the cash a company will earn in the future, added up. The rate used to convert that future cash into today's dollars is the discount rate, and its foundation is the long-term yield.
When yields rise, the present value of future earnings shrinks, which weighs on stocks. Growth and tech names, whose profits sit further out in the future, tend to feel this most. When yields fall, the opposite happens: valuations get a tailwind, and yield-substitute assets like dividend stocks and real estate start looking relatively more attractive.
The 10-year also sets the benchmark for mortgage and corporate-bond rates, so it feeds straight through to borrowing costs across the real economy.
How to read it
- Speed matters more than level. How fast the yield changes rattles markets more than where it sits. A gentle rise is easy to live with; a spike injects volatility into stocks and other risk assets.
- Ask why yields are rising. A rise driven by growth expectations reads as good news; a rise driven by inflation or supply fears reads as bad news, and markets react to the two very differently.
- Pair it with the 2-year. The gap between the long end (10-year) and the short end (2-year), the yield spread, is another key signal for reading where the cycle stands.
Indicators worth watching alongside
The 10-year yield comes into sharper focus when you read it alongside the dollar index, the yield curve, and inflation gauges.
In the macro tab of the Global Market Dashboard, you'll find the U.S. 2-, 10-, and 30-year yields together with the yield spread. Check which way long-term rates are heading right now. For the wider picture, see Getting Started with Global Markets.
Primary source: Daily Treasury yield curve, U.S. Treasury
This article is for informational purposes only and is not investment advice.