One of the first assets to react when markets shake is crude oil. It connects to everything from gasoline prices to airfares, shipping costs, and the inflation data, so reading the direction of oil lets you gauge the temperature of the whole economy. That's why crude gets called the traffic light of the real economy.
WTI vs. Brent: what's the difference
The two benchmarks that come up most when people talk oil prices are WTI and Brent.
WTI, or West Texas Intermediate, is produced and traded inland in the US, and reflects the US economy and shale-production conditions well. Brent is a North Sea benchmark, closer to the reference price for the global market including Europe and Asia. Roughly two-thirds of the world's crude gets priced off Brent.
The gap between the two, known as the spread, widens or narrows with transport costs, regional supply and demand, and US crude-export conditions. Brent usually trades a bit above WTI, and when that gap blows out abnormally, it can signal a US supply glut or a transport bottleneck.
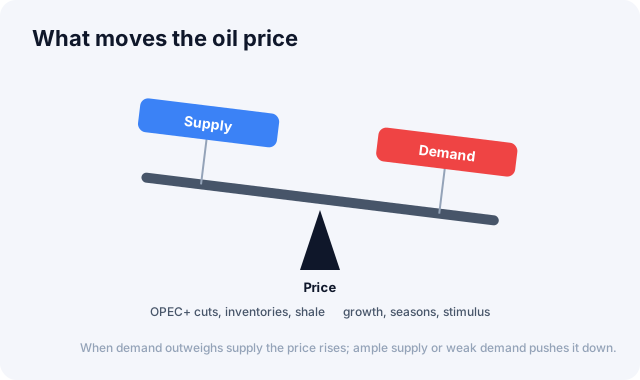
When demand outweighs supply the price rises; ample supply or weak demand pushes it down.
The key drivers
Oil is priced by the balance of supply and demand, and both sides are highly volatile.
OPEC+ policy matters most. When the group of major producers, including Saudi Arabia and Russia, decides to cut or raise output, supply swings immediately, and markets react not just to the actual decision but to cut expectations ahead of meetings. US shale production plays a similar role from the other side: when prices rise, shale output increases and adds supply, acting as a kind of automatic stabilizer. This has tended to cap the upside in oil compared with the past.
Geopolitical risk adds another layer. Middle East conflict, sanctions, and disruptions to key routes like the Strait of Hormuz push prices up on supply fears, but absent an actual disruption, that fear premium can drain away quickly. The broader economy matters too: a strong economy lifts transport and industrial activity, which means more demand, while rising recession fears suppress prices through weaker demand. That's part of why oil also reads as a leading economic signal. Inventory data, like the weekly US crude figures from the EIA, reads as bearish when stocks build more than expected and bullish when they draw down. And because oil trades in dollars, when the dollar strengthens, crude gets more expensive for holders of other currencies, which weighs on demand.
Contango and backwardation
Oil's price to buy right now, the spot price, differs from its price for delivery months out, the futures price. The shape of that curve tells you something about the state of the market.
In contango, far-dated prices run higher than today's, usually a sign that supply is ample right now. In backwardation, today's price runs higher than future prices, signaling tight supply: buyers are willing to pay a premium to get oil immediately.
This structure matters especially for oil-ETF investors. In a strongly contango market, an ETF that rolls its futures each month swaps into a pricier next-month contract, and that roll cost accumulates over time. The ETF can end up falling even when the underlying oil price is flat.
How oil feeds into markets
Oil flows directly into prices through gasoline, heating, and transport costs, so a spike can build inflation (CPI) pressure, which in turn builds pressure for rate hikes. It also splits winners and losers by sector: a boon for energy companies, but a burden on airlines, transport, and chemicals, where fuel is a major cost. That ties into the phase where energy shines in sector rotation. And higher fuel prices cut into households' disposable income directly, which can slow consumption; oil sometimes gets described as a tax on consumers for this reason.
FAQ
Q. Does rising oil always mean inflation and higher rates? Mostly, but the cause matters. Oil rising on strong demand reflects a strong economy. Oil rising on a supply disruption, like war or output cuts, raises fears of stagflation, a weak economy paired with rising prices, which can be more negative for markets.
Q. How do I invest in oil? Most individuals access it through oil-futures ETFs, but because of the contango roll cost described above, a long hold may not track the oil price well. Energy-company stocks or ETFs can be an alternative.
Q. Should I watch WTI or Brent? Brent works better for the global trend, WTI for the US situation specifically. They usually move together, so watching either one gives you the broad direction.
How to read it
- Distinguish supply-driven moves from demand-driven ones. The same rise can mean the opposite thing depending on whether it comes from output cuts or a strong economy.
- Read it with the dollar and inflation. Oil gets a richer reading alongside the dollar and inflation data.
- Check whether a spike will last. Short-term spikes from geopolitical shocks often reverse quickly.
Indicators worth watching alongside
Oil becomes clearer when read together with the dollar index, inflation (CPI), and market sentiment. The Global Market Dashboard shows oil and other commodity prices alongside the dollar index and inflation on one screen. To see what commodities signal in the whole market, also read Getting Started with Global Markets.
Primary source: Petroleum data, U.S. EIA
This article is for informational purposes only and is not investment advice.