On days when stocks tumble, the news fills with phrases like "investors are gripped by fear." When markets set record highs day after day, the word "overheated" is never far behind. The mood sounds vague, but you can actually measure it fairly concretely by combining several market data series into a single number from 0 to 100. The best-known version is the Fear & Greed Index. Today's exact score changes daily, but once you know how to read the number, that skill keeps paying off.
What the Fear & Greed Index is
The index shows, as one number, whether market participants lean toward fear (selling pressure) or greed (buying pressure). The closer to 0, the more extreme the fear; the closer to 100, the more extreme the greed. The scale usually splits into five bands:
- 0-24, Extreme Fear. Investors selling in something close to panic.
- 25-44, Fear.
- 45-55, Neutral.
- 56-74, Greed.
- 75-100, Extreme Greed. Possible overheating or overbought conditions.
The reason the index is worth watching is that it does not just read the mood. It builds the number from several objective data series.
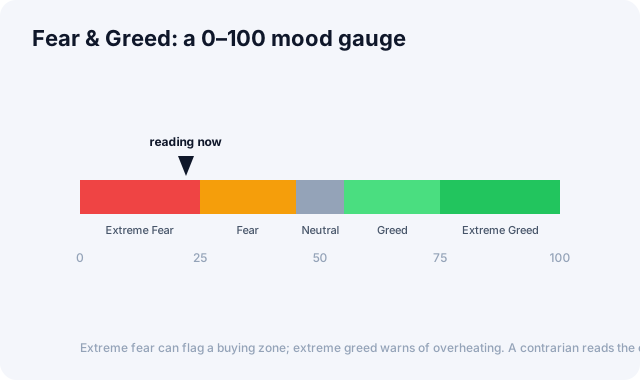
The index runs 0–100; extreme fear can mark a buying zone and extreme greed warns of overheating.
The seven components of the CNN Fear & Greed Index
The CNN Fear & Greed Index covers the U.S. stock market and combines seven signals.
- Market momentum. How far the S&P 500 sits above or below its 125-day moving average.
- Stock price strength. The number of stocks hitting 52-week highs versus 52-week lows.
- Stock price breadth. The difference between advancing and declining volume.
- Put/call ratio. How many puts (bets on a decline) trade relative to calls.
- Market volatility (VIX). Whether the volatility index is running higher than usual.
- Junk bond demand. The yield gap between risky high-yield bonds and safe Treasuries.
- Safe haven demand. The recent return gap between stocks and Treasuries.
Each one measures the same question from a different angle: are investors avoiding risk or seeking it? When puts surge and the VIX spikes, the index moves toward fear. When junk-bond demand rises and more stocks hit new highs, it moves toward greed.
The crypto Fear & Greed Index
The crypto market has its own version, provided by Alternative.me. It combines volatility, trading volume and momentum, social-media mentions, Bitcoin dominance, and Google search trends. It uses the same 0 to 100 scale as the stock index, but crypto's higher volatility means it reaches extreme values more often.
How to use it: a contrarian tool
Warren Buffett's line, "be fearful when others are greedy, and greedy when others are fearful," captures the point. The index is mostly used as a contrarian signal.
- Extreme Fear (0-24): assets may be undervalued after heavy selling. For a long-term investor this can be a buying opportunity.
- Extreme Greed (75-100): a stretch where overheating raises the odds of a pullback, and a time to be careful about new entries.
So should you always buy when the index bottoms out? The honest answer leans closer to "no." One caveat matters more than the rest. The Fear & Greed Index does not pinpoint timing. Markets can fall further from Extreme Fear, and Extreme Greed can last for months while prices keep climbing. All the index tells you is the temperature of current sentiment, so leaning on it alone to decide when to buy or sell is risky.
Read it alongside other indicators
The Fear & Greed Index means more when you read it next to other sentiment and macro gauges, such as the VIX, the put/call ratio, and the yield curve. If the fear gauge is near a bottom while the VIX also spikes and credit spreads widen, several places are confirming market stress at once.
On the Global Market Dashboard you can see the CNN Fear & Greed Index and the crypto Fear & Greed Index together, as gauges and 180-day trend charts, down to the score of each component. Use it to gauge quickly which way sentiment is leaning. To frame where sentiment fits in the wider market, start with Getting Started with Global Markets.
Primary source: Crypto Fear & Greed Index, Alternative.me
This article is for informational purposes only and is not investment advice.