Stocks have valuation metrics like the P/E and P/B ratios, but Bitcoin has no revenue or earnings in the traditional sense. Instead, it has the unusual property that every transaction gets recorded on a public blockchain, and a family of on-chain indicators has grown up to analyze that data. This article covers the three most widely used: MVRV, NVT, and SOPR.
1. MVRV Z-score: a gauge of over- and undervaluation
MVRV, short for Market Value to Realized Value, compares two kinds of market cap. Market value is the current price multiplied by circulating supply, the market cap we usually talk about. Realized value is the total valued at the price each coin last moved at, a concept close to the market's average cost basis.
A high MVRV ratio means the current price sits well above investors' average purchase price, implying large unrealized gains and a possible state of overvaluation. When it falls below 1, the market as a whole is on average sitting at a loss.
In practice, analysts often use the volatility-adjusted MVRV Z-score instead of the raw ratio. Historically, very high Z-scores, signaling overheating, have tended to appear near cycle tops, while very low ones have shown up near bottoms. These are only tendencies, though, not magic numbers that pin the exact top or bottom.
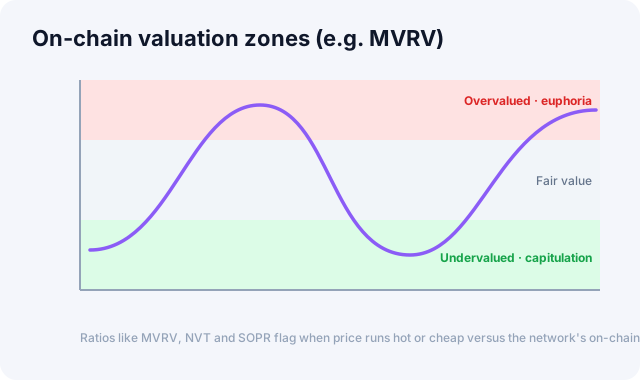
Ratios like MVRV, NVT and SOPR flag when price runs hot or cheap versus the network's on-chain value.
2. The NVT ratio: Bitcoin's "P/E"
NVT, or Network Value to Transactions, divides network value (market cap) by on-chain transaction volume. If a stock's P/E is price relative to earnings, NVT can be seen as price relative to actual usage, meaning transaction throughput.
A high NVT means the price is expensive relative to the transaction volume the network actually processes, which can point to speculative overheating. A low NVT means the price is cheap relative to active usage, suggesting possible relative undervaluation.
NVT's limitation is that its value shifts a lot depending on how "transaction volume" gets defined. Internal exchange transfers or wash trading can distort it, so it works better for reading the trend than as a standalone signal.
3. SOPR: are investors taking profits or cutting losses?
SOPR, or Spent Output Profit Ratio, shows whether the coins that moved, meaning were sold, at a given moment were on average sold at a profit or a loss. The calculation is simple: the price sold divided by the price bought.
When SOPR runs above 1, the sold coins are on average in profit, meaning the market is taking profits. At exactly 1, that's break-even, and this line often acts as psychological support or resistance. Below 1, selling at a loss, often called capitulation, dominates, which can signal a fear phase.
In bull markets, SOPR tends to find support above 1; in bear markets, it tends to meet resistance below 1. So how SOPR crosses the 1 line gets used as a clue to shifts in sentiment.
Cautions when using on-chain indicators
These metrics are not timing tools. They show the possibility that the market sits in an under- or overvalued zone, but they don't pinpoint exact entry and exit points, and extremes can go further to extremes. They're also sensitive to data definitions, since providers compute transaction volume and realized value differently, so the trend and relative position matter more than the absolute value. And they're Bitcoin-centric by design, so they may not apply directly to other crypto assets, or their meaning may weaken there.
On-chain indicators work best read alongside the price chart, derivatives data like funding rates and open interest, and the Fear & Greed Index. Their real appeal is the glimpse they give into the behavior of long-term holders versus short-term traders, something price alone can't show.
In the crypto tab of the Global Market Dashboard, you'll find the MVRV Z-score, NVT, and SOPR together as one-year trend charts. See the flows beyond price.
This article is for informational purposes only and is not investment advice.